Saint-Henri
Snapshot of
Saint-Henri
Discover key facts
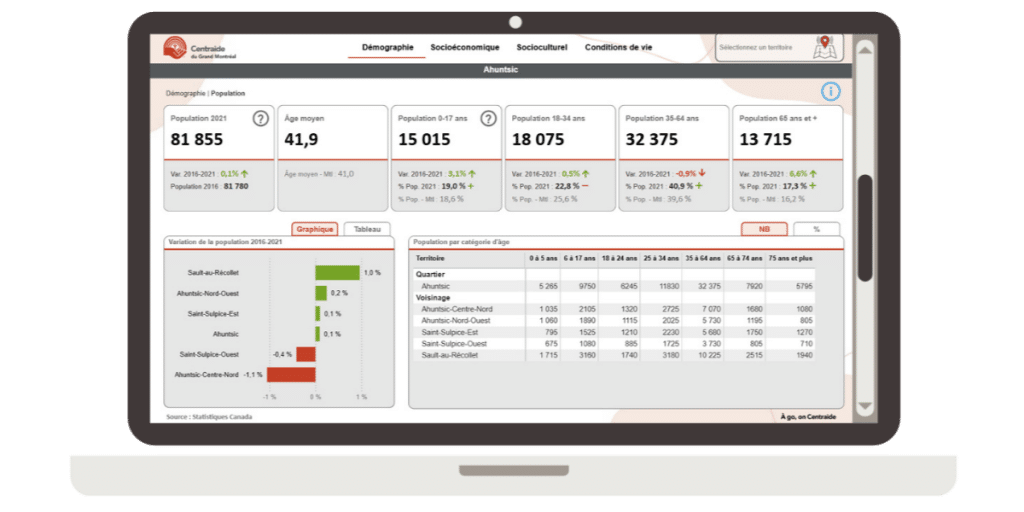
👨🏻🦱 Population – strong presence of young adults
The neighbourhood stands out for its population aged 18 to 34, which represents 39% of residents, well above the Montreal average (26%). The proportion of children (13%) and seniors (11%) is much lower than the Montreal averages (19% and 16%, respectively). This significant presence of young adults is characteristic of central Montreal neighbourhoods, including several in the Southwest.
👩👧 Single-parent families – strong presence
44% of families in the neighbourhood are single-parent, one of the highest rates on the island and well above the Montreal average (31%), representing 735 families.
👴 People living alone – more common among seniors
28% of residents (4,725 people) live alone, a proportion higher than in Montreal (19%). Among seniors, this rate rises to 53% compared with 37% in Montreal, making it one of the highest on the island. Seniors in Saint-Henri and, more generally, in the Southwest are more likely to live alone than other Montrealers.
📍 Poverty – slightly above the Montreal average
13% of the neighbourhood’s population (2,115 people) are low-income, slightly higher than Montreal’s average (11%). The gentrification in the neighbourhood has led to a sharper decline in low-income residents between 2016 and 2021 (-48%), especially among children aged 0 to 17.
✏️ Education – mixed picture
Among adults aged 25 to 64, the proportion of undereducated residents (without a high school diploma) is lower (8%) than the Montreal average (9%) and has declined significantly between 2016 and 2021 (-22%). However, although few in number, high school students in the neighbourhood face significant challenges in graduation. Their graduation rate, the lowest on the island of Montreal, was only 65% in 2023, well below the Montreal average (84%), similar to several Southwest Montreal neighbourhoods.
🏢 Housing – high proportion of subsidized housing
18% of Saint-Henri’s housing is subsidized, well above the Montreal average (8%). These include all units where rent is determined based on income (social housing, HLM, Rent Supplement Program, etc.).

Dashboard
Consult this dashboard to access a wide range of demographic, socio-cultural/economic, and living-condition data.