Peter-McGill
Snapshot of
Peter-McGill
Discover key facts
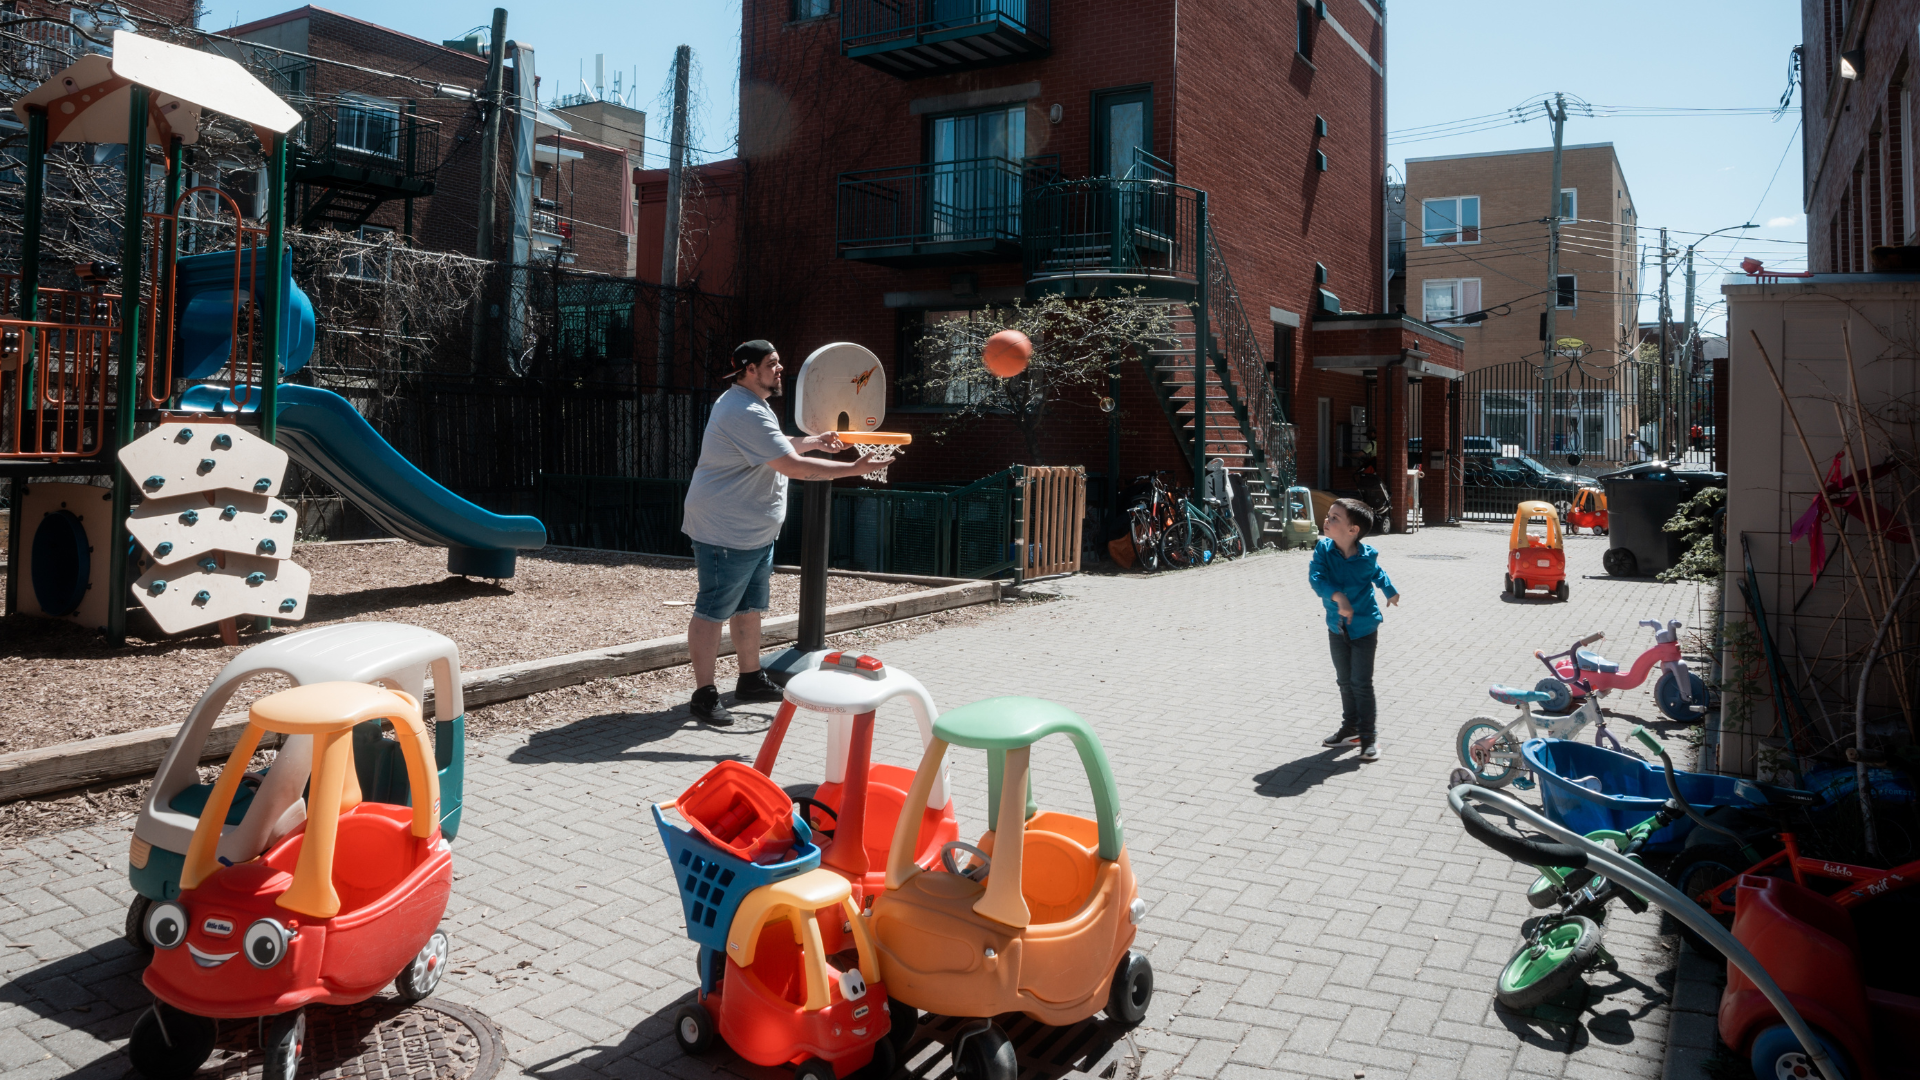
📍 Population – rapid growth and strong presence of young adults
Between 2016 and 2021, Peter-McGill experienced one of the fastest population growths on the Island of Montreal (+22%), a rate seven times higher than the city average (+3%). The neighborhood has a young population: half of its residents are aged 18 to 34, including many students.
👴 People living alone and seniors – high prevalence
One third of the population (33%, or 13,195 people) lives alone, one of the highest rates in Montreal and well above the city average (19%). This trend is particularly pronounced among seniors, 45% of whom live alone. Living alone is a defining feature of Montreal’s downtown neighborhoods.
🏚️ Poverty – highest rate on the island
The neighborhood has the highest low-income rate on the Island of Montreal (31%, or 12,750 people). All age groups are more affected than the city average (0–17, 18–64, and 65+). Families are few but particularly vulnerable, with a low-income rate of 40% among single-parent families—the highest in the Greater Montreal Centraide territory.
🌎 Recent immigrant population and non-permanent residents – key arrival neighborhood
Immigrants make up 37% of the population (14,895 people), above the Montreal average (33%). Nearly one in three residents is a recent immigrant, the highest proportion on the island. The neighborhood is also one of the main destinations for non-permanent residents on the island, with over 11,000 living here.
✏️ Youth graduation – among the lowest in Montreal
The high school graduation rate among youth is one of the lowest on the island, well below the Montreal average: 70% compared with 84% in 2023.
🏢 Housing – highest rents on the island
Average rents in the Ville-Marie borough, which includes Peter-McGill, are the highest on the island: $1,884 per month for a two-bedroom apartment (2024). The proportion of renter households spending an excessive share of their income on housing is also the highest in Montreal: 54% compared with 28% for the island as a whole.

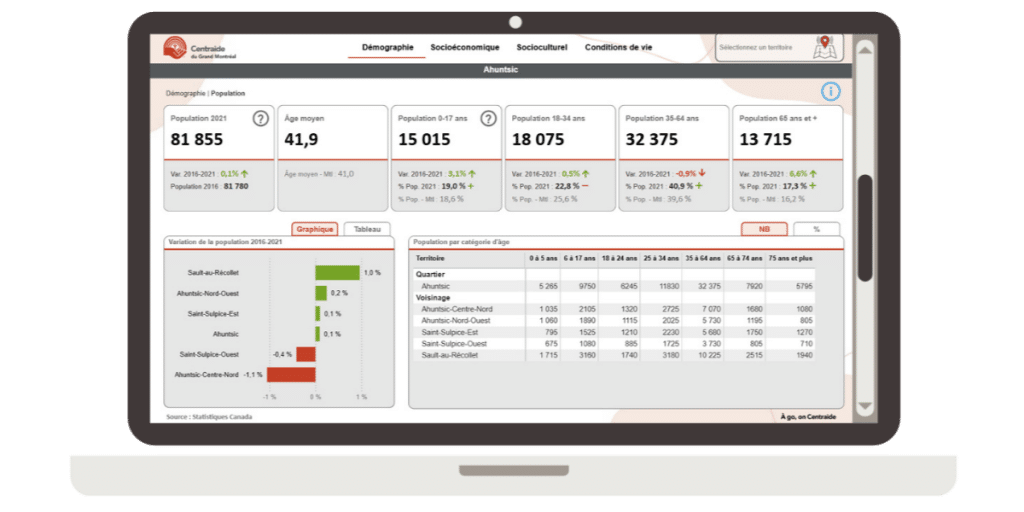
Dashboard
Consult this dashboard to access a wide range of demographic, socio-cultural/economic, and living-condition data.