Verdun
Snapshot of
Verdun
Discover key facts
👩👧 Single-parent families – more common in the Wellington-de-l’Église sector
30% of the neighbourhood’s families are single-parents, a rate comparable to the Montreal average (31%), representing 2,625 families. The picture varies by sector: 24% of families on Île-des-Sœurs (Nun’s Island) are single-parent, compared with 37% in the Wellington-de-l’Église sector, which also has the highest number of single-parent families (1,105 families).
👴 People living alone and seniors – concentrated in Wellington-de-l’Église
22% of residents in the neighbourhood live alone, a rate above the Montreal average (19%), but higher in the Wellington-de-l’Église sector (26%), which accounts for half of Verdun’s people living alone (7,220 out of 14,974). Among seniors, 53% live alone in Wellington-de-l’Église, one of the highest rates on the island, whereas in other Verdun sectors, rates are closer to the Montreal average (37%).
📍 Poverty – slightly below the Montreal average
10% of the neighbourhood’s population, or 6,880 people, live on low income, slightly below the Montreal average (11%). Rates vary by sector: 8% in Desmarchais-Crawford, 9% on Île-des-Sœurs (Nun’s Island), and 12% in Wellington-de-l’Église. While adults have the highest low-income rate across Verdun, the youth aged 0 to 17 are the most affected age group on Île-des-Sœurs (Nun’s Island) (12%).
🌎 Immigrant population – strong presence on Île-des-Sœurs
Nearly half of Verdun’s 16,915 immigrants live on Île-des-Sœurs (Nun’s Island) (8,075 people), which also has a proportion above the Montreal average (38% vs. 33%). Rates are much lower in other sectors: 13% in Desmarchais-Crawford and 22% in Wellington-de-l’Église. The neighbourhood also has a significant number of non-permanent residents (4,265 people), half of whom (2,205) live in Wellington-de-l’Église.
👨🏾🤝👨🏼 Diversity – mixed picture
24% of residents belong to visible minority groups, a rate below the Montreal average (38%). On Île-des-Sœurs (Nun’s Island), this proportion is higher (35%) and has seen notable growth of 31% between 2016 and 2021.

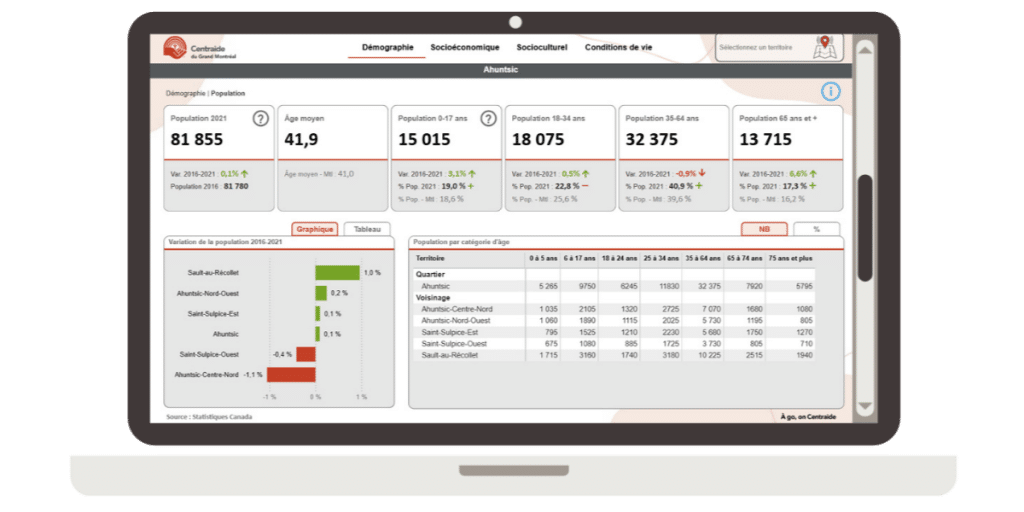
Dashboard
Consult this dashboard to access a wide range of demographic, socio-cultural/economic, and living-condition data.