MRC du Haut-Richelieu
Snapshot of the
MRC du Haut-Richelieu
(Henryville, Lacolle, Mont-Saint-Grégoire, Noyan, Saint-Alexandre, Saint-Blaise-sur-Richelieu, Saint-Georges-de-Clarenceville, Saint-Jean-sur-Richelieu, Saint-Paul-de-l’Île-aux-Noix, Saint-Sébastien, Saint-Valentin, Sainte-Anne-de-Sabrevois, Sainte-Brigide-d’Iberville and Venise-en-Québec)
Discover key facts
👴 Population – fewer families and many living alone
The MRC du Haut-Richelieu has the lowest concentration of families on the South Shore (32% of households), resulting in a higher share of people living alone (14%). Seniors also tend to live alone more often than in other MRCs. Many people living alone, including seniors, reside in Saint-Jean-sur-Richelieu.
👩👧 Poverty – high concentration in Saint-Jean-sur-Richelieu
There are 5,815 low-income residents in the MRC du Haut-Richelieu, with a strong majority (85%) living in Saint-Jean-sur-Richelieu (4,940 people). The overall low-income rate is 5%, the highest among the five MRCs in Centraide’s territory. Median after-tax household income is $65,000, the lowest among South Shore MRCs.
✏️ Low educational attainment (without a high school diploma) – pronounced among adults in Haut-Richelieu
14% of adults aged 25–64 (8,695 people) do not have a high school diploma, higher than the South Shore average (10%). Three-quarters (75%) of these adults live in Saint-Jean-sur-Richelieu, which also has a 14% rate. Several other municipalities in the MRC show elevated levels of low educational attainment among adults.
🎓 Youth graduation – lower than average
The high school graduation rate in the MRC du Haut-Richelieu is 76%, compared with 83% on the South Shore in 2023. The rate is trending upward, having increased from 72% in 2021 to 76% in 2023.
🌎 Diversity and immigration – low but growing
The MRC du Haut-Richelieu has a smaller share of immigrants (4%) and visible minority residents (4%) than the South Shore overall (15% and 16%). Between 2016 and 2021, the immigrant population grew by 26% and the population belonging to visible minority groups grew by 76%.

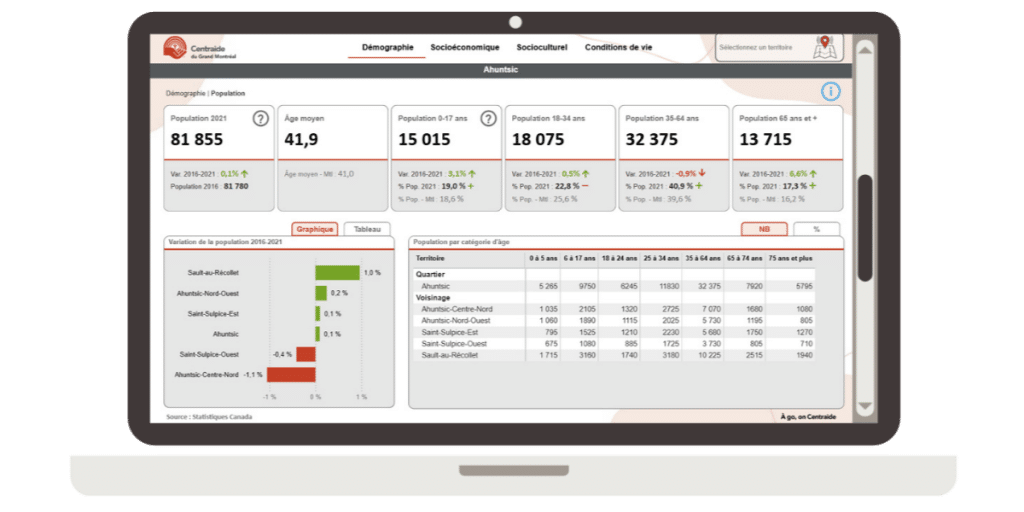
Dashboard
Consult this dashboard to access a wide range of demographic, socio-cultural/economic, and living-condition data.