MRC des Jardins-de-Napierville
Snapshot of the
MRC des Jardins-de-Napierville
(Hemmingford (Township), Hemmingford (Village), Napierville, Saint-Bernard-de-Lacolle, Saint-Cyprien-de-Napierville, Saint-Jacques-le-Mineur, Saint-Michel (City), Saint-Patrice-de-Sherrington, Saint-Rémi, Saint-Édouard, and Sainte-Clotilde)
Discover key facts
📍 Population – growth and strong presence of youth
Between 2016 and 2021, the MRC des Jardins-de-Napierville recorded one of the strongest population growths among the five MRCs within Centraide’s territory (+9%), above the average for all MRCs (+6%) and Montreal (+3%). Saint-Rémi (+11%) and Sainte-Clotilde (+63%) had the most marked increases.
🏚️ Poverty – low
Four percent of the population, or 1,205 people, live on a low income, slightly below the South Shore average (5%). Nearly 40% of low-income residents live in the most populous municipalities, Napierville (130 people) and Saint-Rémi (370 people).
✏️ Low educational attainment (without a high school diploma) – highest among the five MRCs in Centraide’s territory
19% of adults aged 25–64 (2,995 people) in the MRC do not have a high school diploma, the highest rate among the five MRCs in Centraide’s territory and well above the South Shore average (10%). At the municipal level, all areas in the MRC show elevated rates, ranging from 14% to 27%.
🎓 Youth graduation – among the lowest in Centraide’s territory
The high school graduation rate in the MRC is 76%, well below the South Shore average (83% in 2023). The rate slightly declined from 79% in 2021 to 76% in 2023.
🌎 Diversity and immigration – low but growing
The MRC has a low share of immigrants (4%) and visible minority residents (3%) compared with the South Shore overall (15% and 16%). Between 2016 and 2021, the immigrant population grew by 36% and the population belonging to visible minority groups grew by 80%.

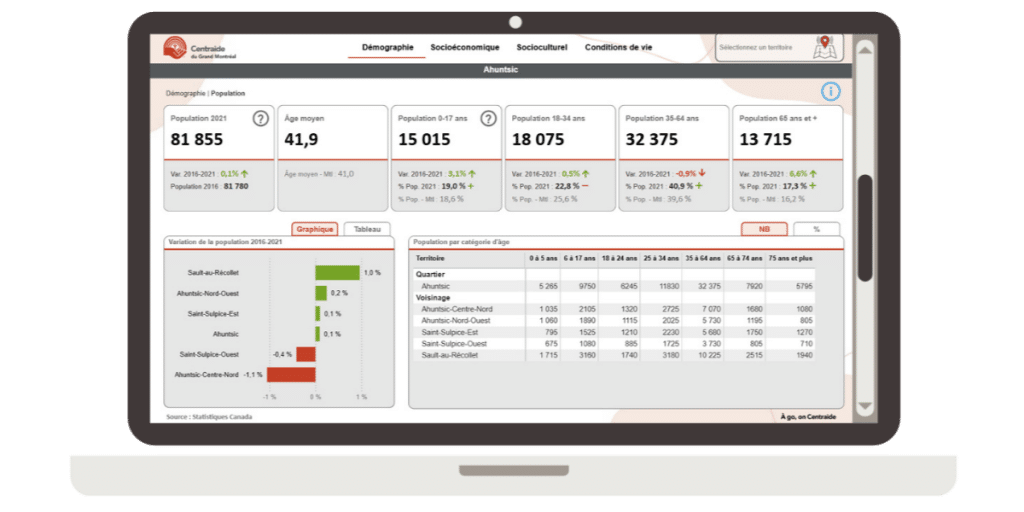
Dashboard
Consult this dashboard to access a wide range of demographic, socio-cultural/economic, and living-condition data.


